
Industry Savings
The graph shows that employees that have successfully completed the post-offer screen have a less severe injury and decreased costs when compared to employees who have not completed the post-offer screen. This results not only in monetary savings to the employer but a quicker recovery for the employee.
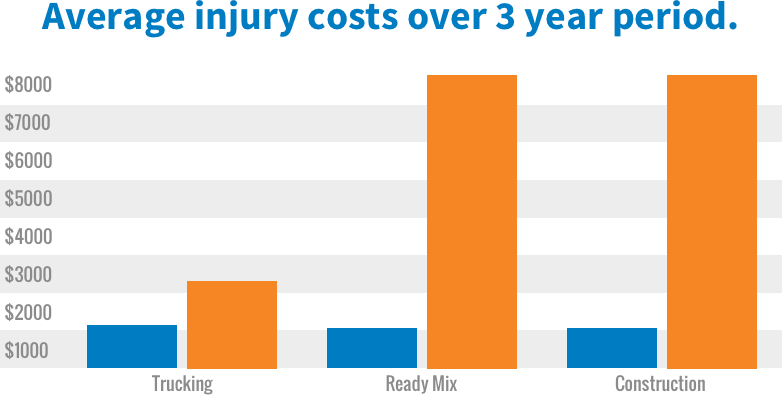
Not Screened
Screened
